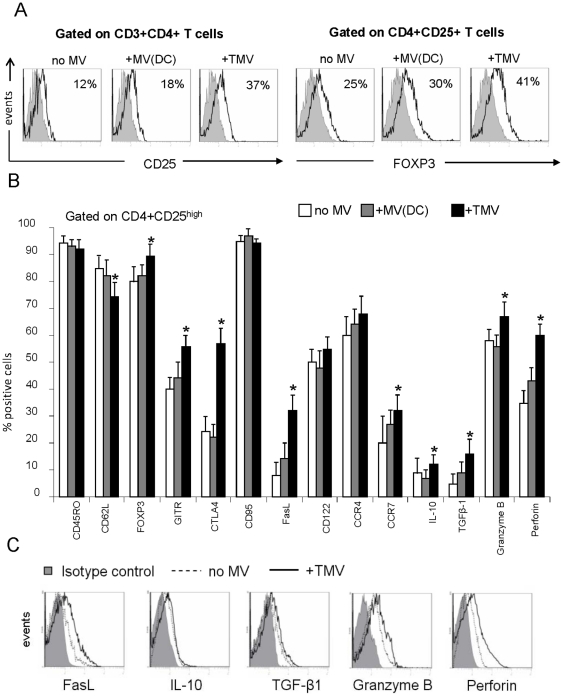
Figure 4. TMV Convert CD25neg T cells to Treg.
(A) Flow cytometry histograms of cultured (d5) CD4+CD25neg T cells showing conversion of CD25neg T cells into CD25+ T cells ± TMV or DC-derived MV (left panel) and expression of FOXP3 in the converted CD4+CD25+ T cells (right panel) in the same cultures. (B) A phenotypic profile of CD4+CD25high T cells present in 7 day cultures of CD4+CD25+ T cells ± TMV or DC-derived MV. T cells were stained with various mAbs and evaluated by multiparameter flow cytometry. The gate is set on CD4+CD25high T cells. The data are mean percentages ± SD of positive cells from three independent experiments. (C) MFI for FasL, IL-10, TGF-β1, granzyme B and perforin expression in CD4+CD25high T cells cultured as described in (B) ± TMV. The data are representative of three independent experiments.

