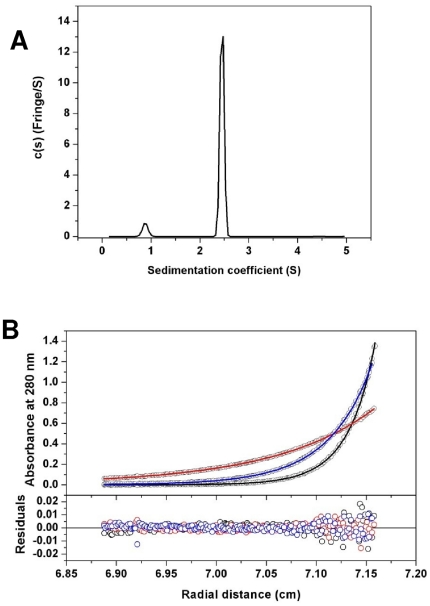
Figure 4. Analytical ultracentrifugation of HA63–286-RBD.
(A) The sedimentation velocity profiles (fringe displacement) were fitted to a continuous sedimentation coefficient distribution model c(s). The experiment was conducted at a loading protein concentration of 0.45 mg/mL in 10 mM Tris pH 8.0, 100 mM NaCl at 20°C and at a rotor speed of 60,000 rpm. The s-values of the proteins are listed in Table 1. (B) Absorbance scans at 280 nm at equilibrium are plotted versus the distance from the axis of rotation. The protein was centrifuged in the above buffer at 4°C for at least 24 h at each rotor speed of 20, 30 and 38 k rpm. The solid lines represent the global nonlinear least squares best-fit of all the data sets to a monomer-dimer self-association model with a very weak KD (288 mM). For clarity, only the loading protein concentration of 5 µM is shown. The r.m.s. deviation for this fit was 0.0037 absorbance units.

