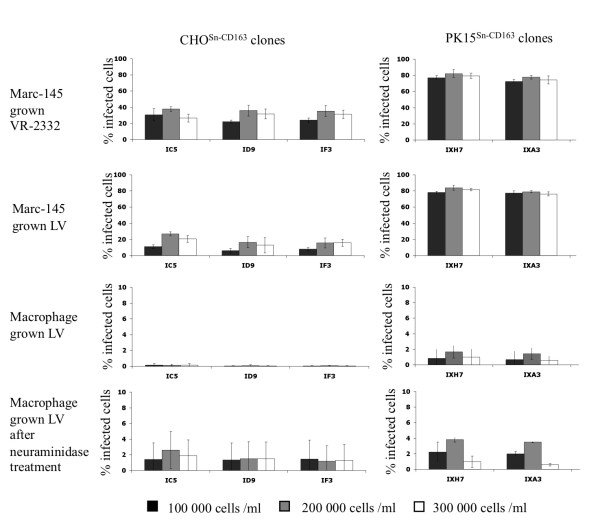
Figure 2.
Effect of cell density on susceptibility of CHOSn-CD163 and PK15Sn-CD163 cells to PRRSV infection. CHOSn-CD163 and PK15Sn-CD163 cells were cultivated for 2 days before they were inoculated with Marc-145 grown LV, Marc-145 grown VR-2332 or macrophage grown LV. The black bars represent a cell density of 100 000 cells/ml, the grey bars 200 000 cells/mL and the white bars 300 000 cells/ml. The graphs show the percentage of infected cells. Values represent mean ± SD of three experiments.

