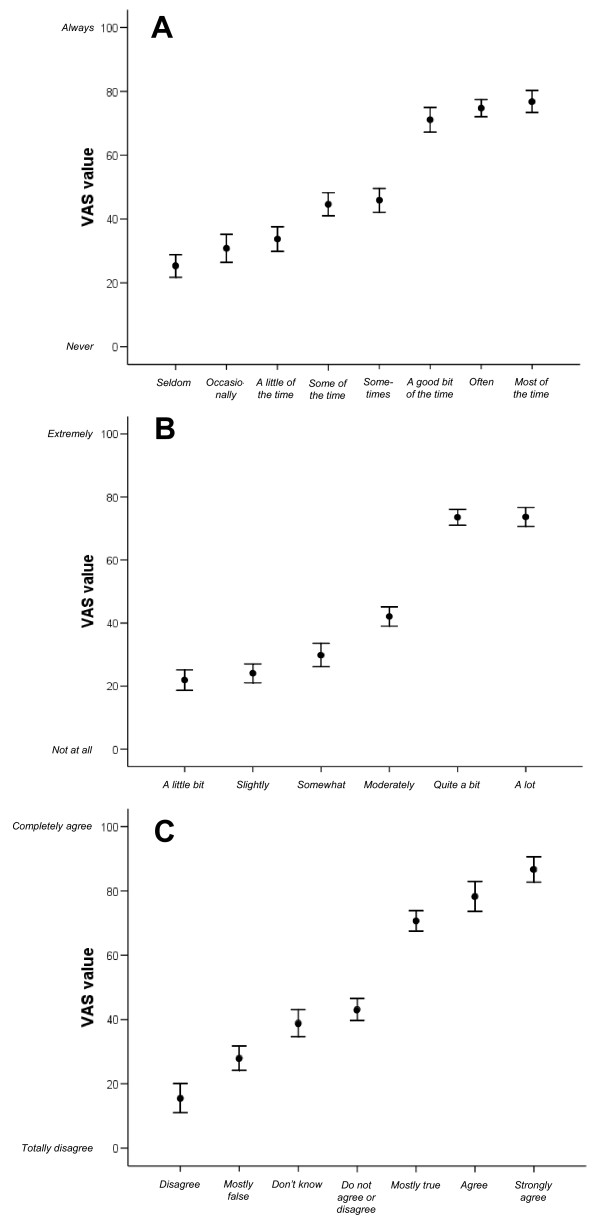
Figure 1.
Response category mean VAS values and 95% CIs. Mean values (black dots) with associated 95% confidence intervals (error bars) for 100-mm visual analog scale (VAS) ratings (y-axis) of the perceived meaning of response category wordings (x-axis) in relation to (A) Never (0 mm) - Always (100 mm), (B) Not at all (0 mm) - Extremely (100 mm), and (C) Totally disagree (0 mm) - Completely agree (100 mm) among people with Parkinson's disease (n = 51) and an age-matched control group (n = 36). See Methods for details.

