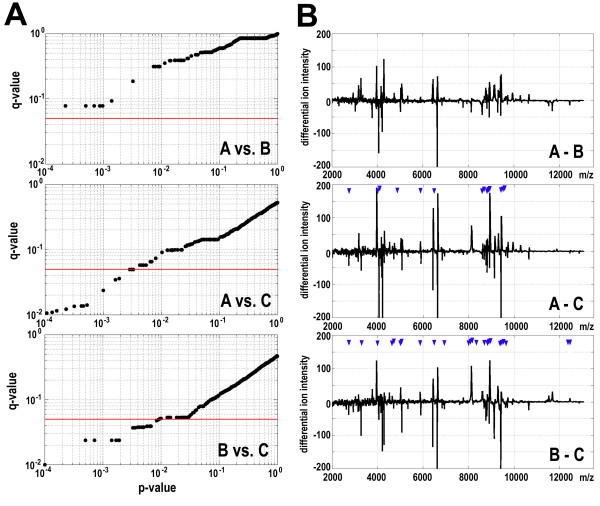
Figure 1.
Assessment of differences of proteome patterns specific for serum samples collected at different time points. A - The q-values were plotted against the p-values of differences between compared samples A. B and C; each dot represents one spectral component, the red horizontal line represents a q-value cut-off equal to 0.05. B - Average differential spectra computed for each pair-wise comparison; blue arrowheads marked positions of spectral components that differentiated samples at high levels of significance (q-value < 0.05).

