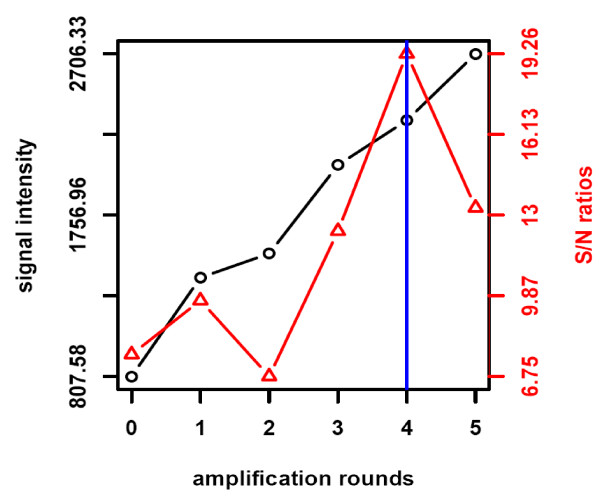
Figure 2.
Optimizing number of amplification cycles. Twelve replicate spots of a colon cancer cell line containing 35 fg pERK were printed on nitrocellulose-coated slides. Detection of pERK was performed by standard near-infrared detection and AMSA comprising different rounds of amplification. Median fluorescence (black) and signal-to-noise ratios (red) were calculated. The blue line summarizes the results for AMSA optimization.

