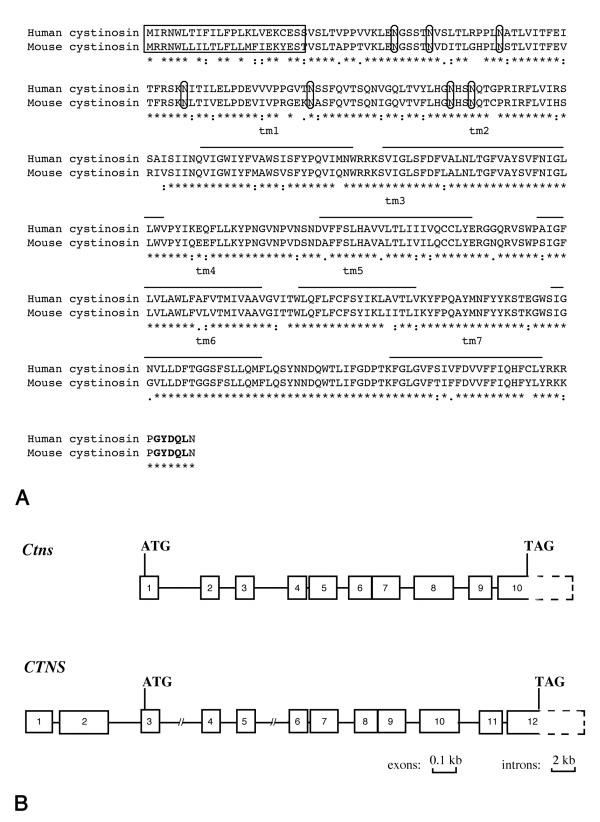
Figure 1.
Comparison of the human and murine CTNS genes and encoded products. (A) Alignment of the human and murine cystinosin sequences. Asterisks indicate identical amino acid residues. Colons indicate residues of high similarity and fullstops residues of low similarity. The uncleavable signal peptide is boxed, the N-glycosylation sites circled, the transmembrane domains overlined and the lysosomal targetting signal is in bold. (B) Schematic representation of the gene structure of CTNS and Ctns. The exons are indicated by solid boxes, the 3' non coding regions by a dashed box and the introns by a solid line. Ctns exon sizes are identical to those reported for CTNS [9]. Intron sizes are as follows: i) Ctns intron 1-3.5 kb; 2-1.5; 3-3; 4-0.127; 5-0.8; 6-0.095; 7-1.1; 8-1.15 and 9-0.35. ii) CTNS intron 1-0.257 kb; 2-2.8; 3-8; 4-1.54; 5-6; 6-0.115; 7-1.2; 8-0.085; 9-1.2; 10-1.683 and 11-0.26.

