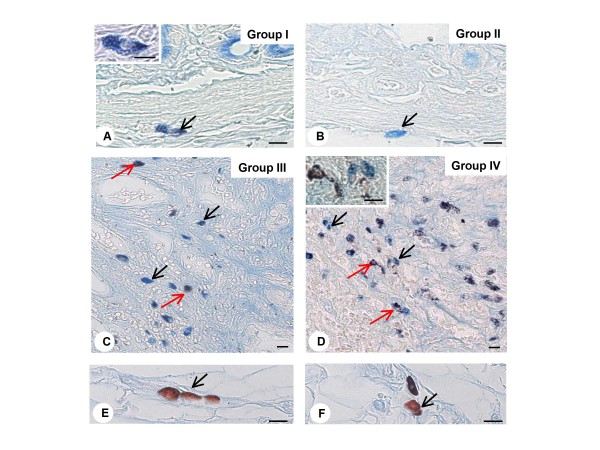
Figure 5.
Phenotypical analysis of mast cells of gastric fragment. A and B) Submucosal layer of non-denervated (group I) and denervated (group II) stomach showing mast cells with cytoplasmic granules positive to alcian-blue (arrows), characterizing mucosal mast cell phenotype - in detail of panel A. C and D) Two mast cell population are noted in the gastric lesions of non-denervated (group III) and denervated (group IV) stomachs: alcian-blue positive mast cells (black arrows) and alcian-blue/safranin positive mast cells (red arrows). E and F) Mast cells with safranin positive granules (arrows) are observed in the mesentery, characterizing connective tissue mast cells. Alcian-blue/Safranin method. Bars: 10 μm (Fig. A-F); 5 μm (detail Fig. A).

