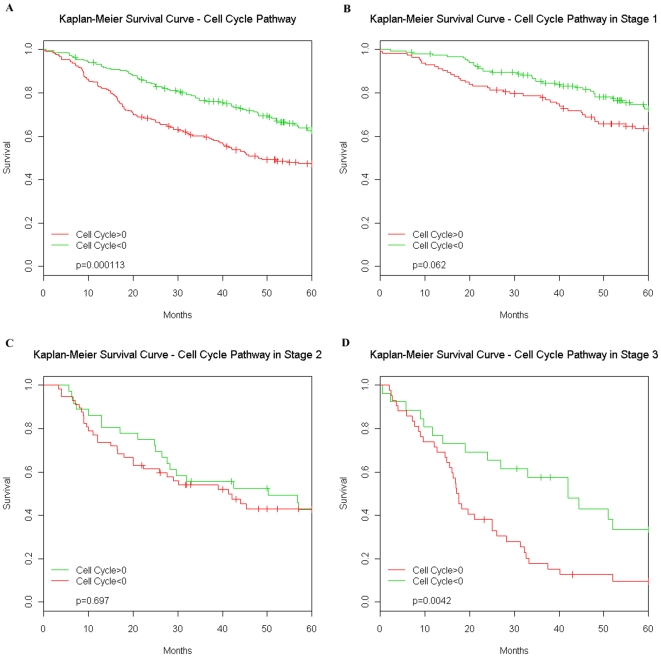
Figure 5. Stage specific survival differences of cell cycle pathway.
(A) Kaplan-Meier survival analysis of the cell cycle stimulatory (CC+) pathway shows that patients with relative over-expression of CC+ do significantly worse (p = 0.000113). This trend is consistent inside each stage however is only marginally significant (p = 0.062) in stage 1 patients (B), not significant in stage 2 patients (C) and highly significant (p = 0.0042) in stage 3 patients (D). Abbreviations: w/, with; w/o, without.

