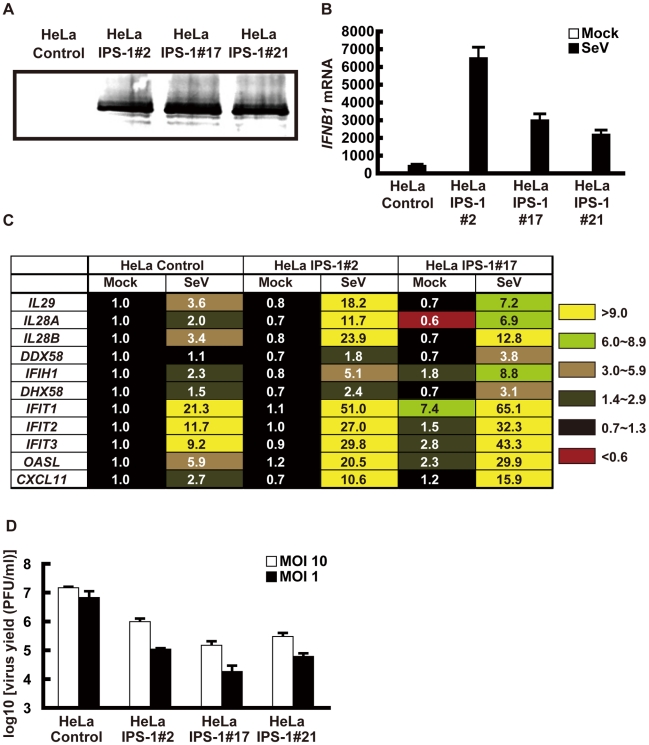
Figure 1. Stable HeLa cell clones expressing FLAG tagged IPS-1.
A, Expression of FLAG-IPS-1 was examined in control and IPS-1-expressing HeLa clones (#2, 17, and 21) by immunoblotting using anti-FLAG antibody. B, Expression of IFNB1 in control and IPS-1-HeLa cells was examined by quantitative real time PCR (qRT-PCR). Open and filled bars indicate mock-treated and SeV-infected cells for 12 h, respectively. Data represent means ± s.d. (n = 3). C, Expression profiles of cytokine and chemokine genes in control and IPS-1-HeLa cells. Total RNA extracted from indicated cells mock-treated or SeV-infected for 12 h was subjected to analysis using a DNA microarray. Relative mRNA levels using a control expression of 1.0 are shown. D, Replication of EMCV in control and IPS-1-HeLa clones. The indicated cell clones were infected with EMCV at a MOI of 1 or 10. The viral titer in the culture medium at 24 h post-infection was determined with the plaque assay. Data represent means ± s.d. (n = 3).

