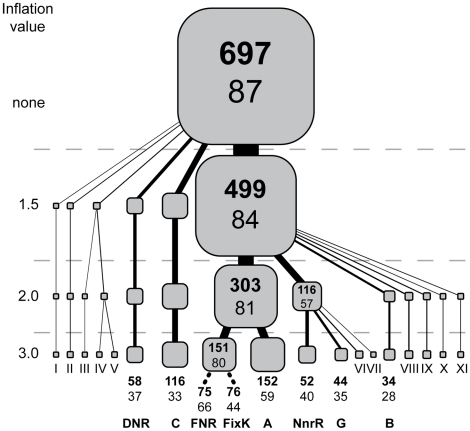
Figure 1. Major sub-families of the CRP/FNR-type transcription factors in 87 representative α-proteobacteria.
The hierarchical tree representation of the amino acid sequence similarities was constructed by partitioning protein groups using increasing clustering stringency (inflation value, see Materials and Methods). The bold numbers within each box represent the number of individual proteins within each cluster and the number below represents the number of species possessing at least one of these proteins. The bottom of the tree shows names for the major 8 sub-families using nomenclature described previously [3]. Minor sub-families could not be classified definitively, so these sub-families are designated by roman numerals.

