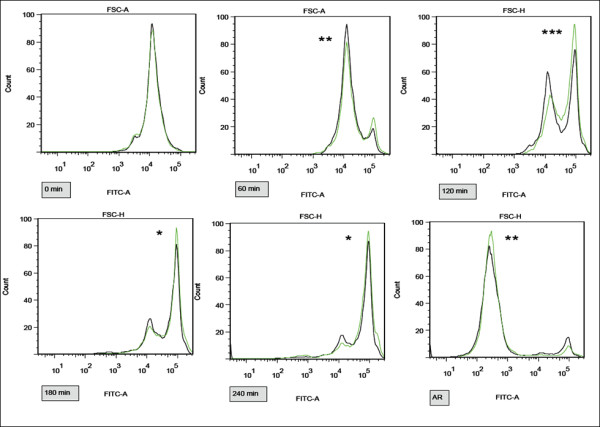
Figure 3.

Differences in capacitation and AR progress between samples A-D exposed by 1 μM E2 and control samples measured by flow cytometry with ACR.2 antibody. Representative pictures of FITC channel histograms at 0, 60, 120, 180, 240 min and after induced AR. Control samples in black, experimental samples in green. The increase in fluorescent intensity (right peak) corresponds to the capacitation progress. Differences among the control and experimental samples in arithmetic mean of the fluorescent intensity in the FITC channel were assessed by t-test. *P < 0.05, **P < 0.01, ***P < 0.001. The most significant difference is recognizable at 120 min.
