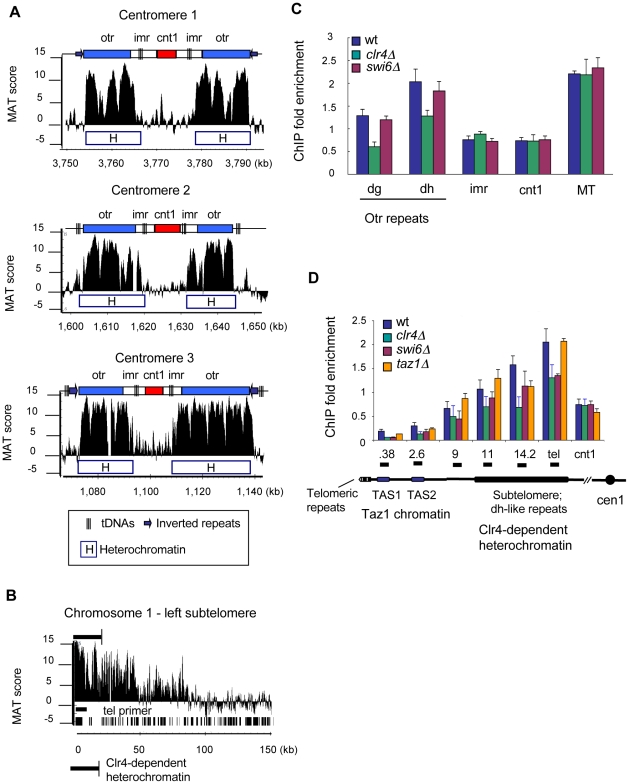
Figure 7. γH2A in the centromeres and telomeres is associated with Clr4-dependent heterochromatin.
(A) Detailed ChIP-on-chip distribution of γH2A at the centromeres. Diagrams above each plot indicate key centromere features: otr – outer centromere dg/dh repeats; imr- inner repeats; cnt –centromere core. (B) Detailed ChIP-on-chip distribution of γH2A in the subtelomere of Chromosome 1. Location of genes and “tel” qPCR primer is shown as black bars below plot. (C) γH2A levels were reduced at the centromeres in clr4Δ cells. γH2A ChIP was performed in indicated strains synchronized by cdc25-22 block. The dg and dh primers are located in the outer centromere repeats. ChIP data is shown as Fold Enrichment, which was calculated relative to the act1 gene. (D) γH2A domain in the subtelomeres colocalizes with heterochromatin and decreases in clr4Δ and swi6Δ cells. ChIP was performed as in (C). Diagram below graph shows the organizational structure of the telomeres (not to scale) and was based on [70]. Primer locations are marked by horizontal black bars (top) and correspond to distance in kilobases from the telomeric repeats.

