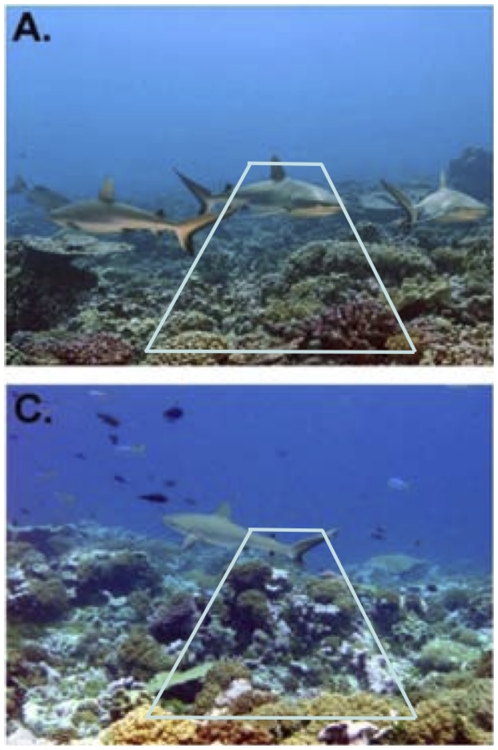
Figure 5. Illustration of an instantaneous count (snapshot) of sharks in a belt-transect UVC (photos from Fig 2A and 2C in Sandin et al. 2008).
To visualize the area that would be covered by a belt-transect, we have drawn in the approximate survey boundaries of a 50 m2 transect (∼4 m wide×12.5 m long which is represented by visibility distance). Sandin et al [9] covered 100 m2 (4 m wide×25 m long) per transect – approximately double the area outlined.

