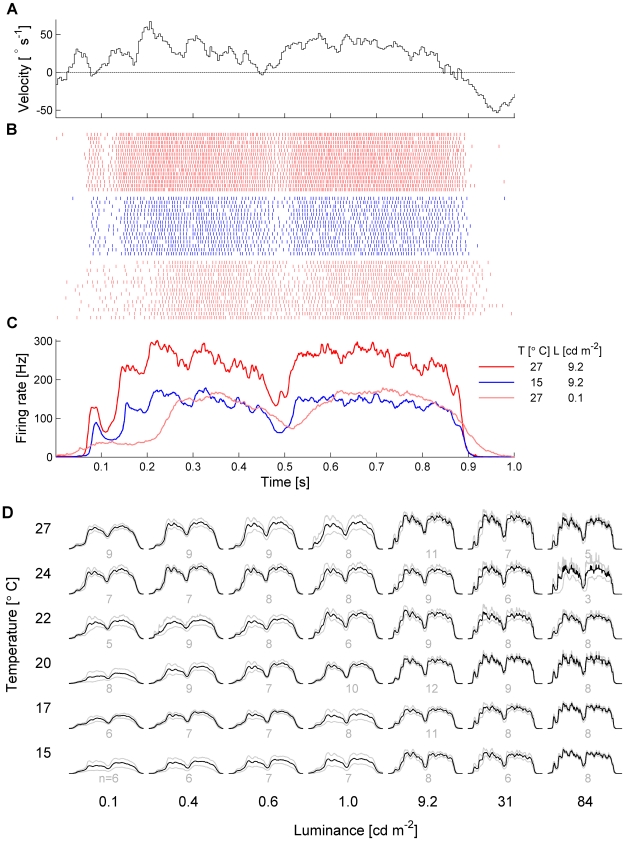
Figure 1. Time dependent-firing rate.
A A segment of the image velocity as a function of time. B Raster plots of the same H1 at different experimental conditions of temperature and light intensity. C Respective average rates calculated using 137 trials for each condition. D Average rates of 325 acquisitions (84 flies) in a wider set of experimental conditions. Scales are the same as indicated in C. For each condition, firing rates of several flies were pooled - n is the sample size and the gray curves are bootstrap confidence intervals ( , 1000 replications).

