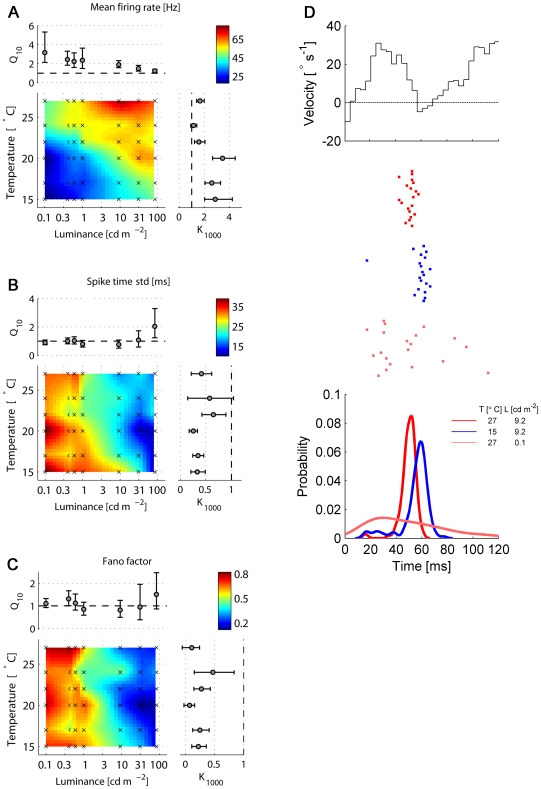
Figure 2. Firing rate and precision as a function of temperature and light intensity.
A Mean firing rate. B Spike jitter, measured as the standard deviation of the first spike after a velocity transient (from negative to positive). C Average Fano factors for transient responses 50 ms after a velocity transition, calculated in an interval of 50ms, using overlapping windows of 20 ms. Color code represents the linear interpolation of the mean values at the experimental points, indicated by the crosses. Q and K
and K are the temperature and luminance coefficients, respectively (for details see text). Error bars are bootstrap confidence intervals (
 , 1000 replications) D Top: Segment of a stimulus waveform during a velocity transition from inhibitory to excitatory direction. Center: Raster plots of the responses in 20 trials at three different conditions, indicated in the legends. Each mark represents the occurrence of one spike. Bottom: Distributions of the arrival time of the first spike for the three different conditions shown above, obtained using a kernel density estimator with optimized width for Gaussian distributions.

