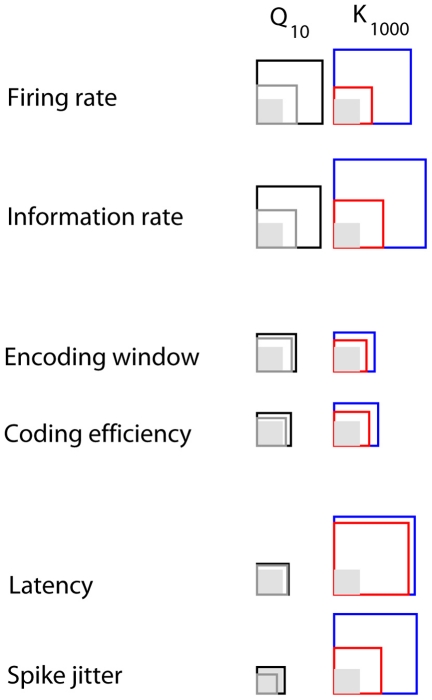
Figure 5. Overview of the results.
The mean coefficient of temperature (Q ) for luminances up to 1 cd m
 are represented by black squares, and for luminances above 1 cd m
 , by gray squares. The shaded region correspond to coefficient of 1. Coefficients smaller than 1 were inverted, for sake of comparison. Similarly, the blue squares represent the mean amplitudes of the coefficient of luminance (K
 ) for temperatures up to 22
 C, whereas red squares represent the mean amplitudes for higher temperatures.

