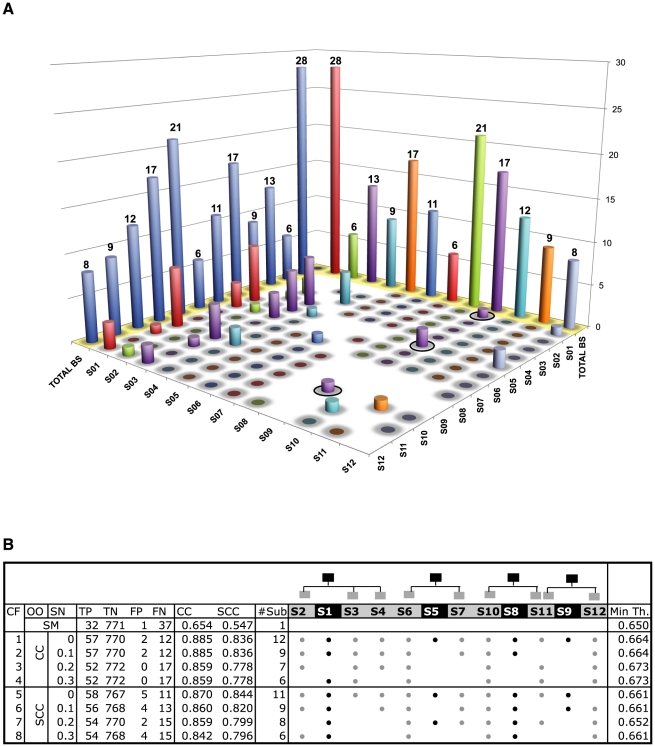
Figure 4. Sensitivity analysis of D&C parameters.
A) Leave-one-submotif-out cross-validation of the PhoP BSs. Each color bar represents a different submotif, and its height shows the number of BSs that it recognizes. Shaded in yellow at the back edge, the height of each bar indicates the number of BSs originally clustered in the corresponding submotif. The inner bars for a given submotif indicate the number of its BSs that are also recognized by other submotifs (e.g., S09 was originally composed by 17 BSs, 1 of these BSs is also recovered S01 (black circle); 2 BSs are also recovered by S05; and 1 BS is also recovered by S10). The diagonal was omitted in its corresponding place for clarity purposes, but drawn in the back as blue bars. The number of BSs recognized by multiple submotifs (i.e., intersections among submotifs) is low as shown by the low height of the inner bars (Table S5). B) Optimal configurations of submotifs encoded by Consensus PWMs obtained from GA optimization of the number and thresholds of submotifs (CF). The fitness function was calculated by either SCC or CC measurements (OO). Different selection pressures (SN) where used as initial constrains (See  parameter in Materials and Methods). TP/TN and FP/FN stand for true/negative and positive/negative predicted values, respectively. #Sub indicates the number of submotifs effectively employed, columns S1 to S12 represent the submotifs organized as families. Dots at the columns (black: general submotif; white: specific submotif) indicate that the corresponding submotif was selected by the optimization process for that configuration (rows). Min Th. corresponds to the minimum learned threshold. SM shows the results obtained by the single motif (See Figure S5 for similar results using MEME and AlignACE methods).

