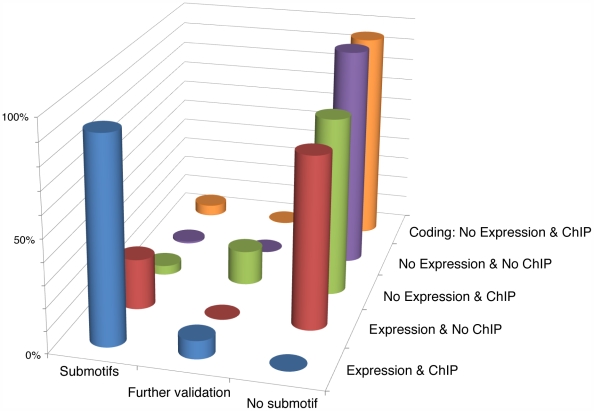
Figure 5. Genome-wide analysis of the S. typhimurium sequences using PhoP submotifs.
Four categories (Y axis) of genes were identified based on the presence or absence of PhoP promoted expression as measured by the tiling array, and the presence or absence of PhoP binding as measured by ChIP experiments. The fifth category corresponds to the presence of ChIP peaks in coding regions corresponding to non-expressed genes. The height of the bars represents the percentage of presence or absence of PhoP BSs identified by the submotifs (X axis), as well as by the need of further validation of the results (See Text S4 for details), within the intergenic regions of genes belonging to the first four categories, and the coding regions corresponding to the fifth category. The analysis performed on the first four categories considered each gene harboring an intergenic region with >20 bp, and/or the head of its corresponding operon as possible binding targets of the PhoP protein. (See Table S7 for gene/operon numeric data).

