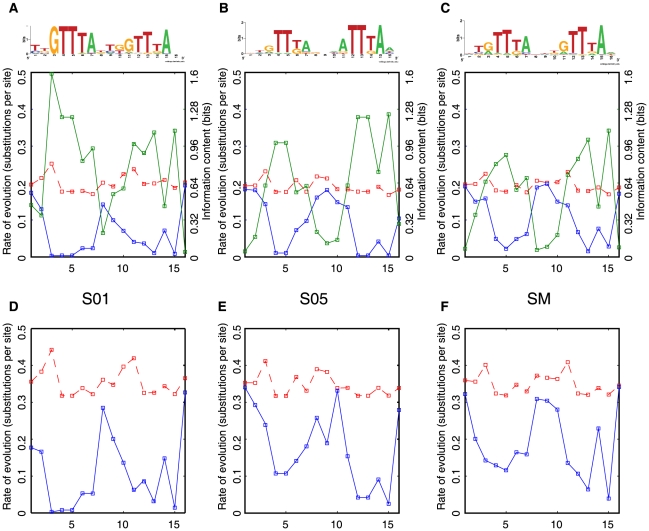
Figure 6. A model of evolution of the PhoP BSs based on submotifs.
Rate of evolution calculated by nucleotide substitutions at each position of the PWMs corresponding to submotifs using the HB model (blue) [18], [19], compared with the background distributions using the HKY model (red) [18], [19] based on randomly selected non-coding sequences from E. coli K-12 and S. typhimurium genomes. The information content (green) is inversely correlated to the rate of evolution of submotifs. A) Low rates of evolution of the S01 submotif. B) High rates of evolution of S05 submotif. C) Rates of evolution of single motif. D) Same as in A), but using an AT rich non-coding intergenic regions in the background model. E) Same as B), but using an AT rich non-coding intergenic regions in the background model. F) Same as C), but using an AT rich non-coding intergenic regions in the background model.

