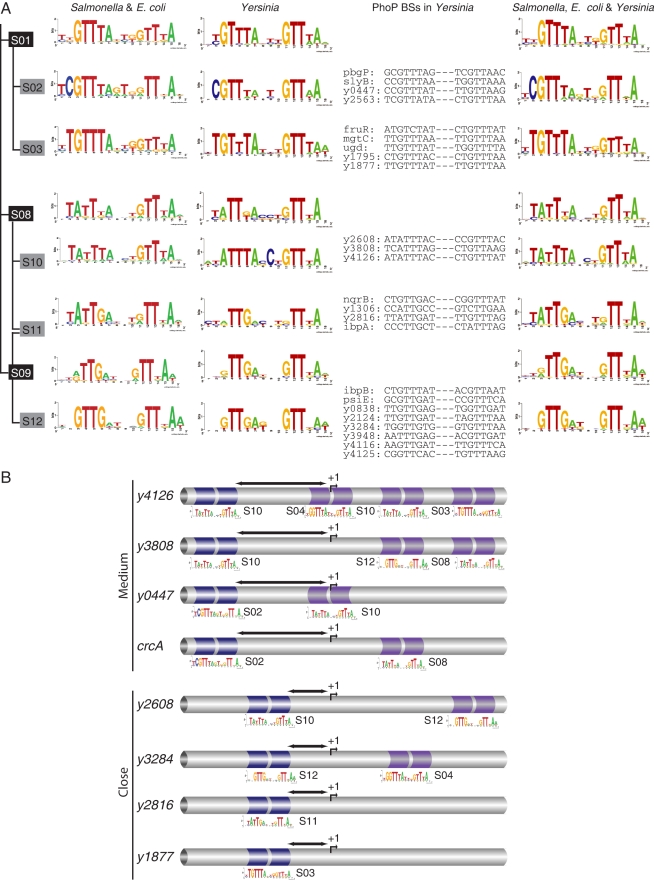
Figure 8. The PhoP regulon in Yersinia pestis KIM.
A) PhoP BSs detected in Y. pestis promoters based on E. coli K-12 and S. typhimurium (lefts panel). Submotifs reconstructed from PhoP targets detected in Yersinia [44] (middle panel). Joined submotifs from E. coli, Salmonella, and Yersinia PhoP BSs (right panel). B) Promoter architectures and submotifs identified in PhoP-activated promoters in Yersinia. Schematic based on DNase I footprinting analysis [58] of the promoter regions for selected genes (blue: highest affinity; violet: lower affinity sites). BSs overlapping or downstream the TSS correspond to repression sites. Close and medium distances between PhoP BSs and the RNAP BSs are highlighted by arrows.

