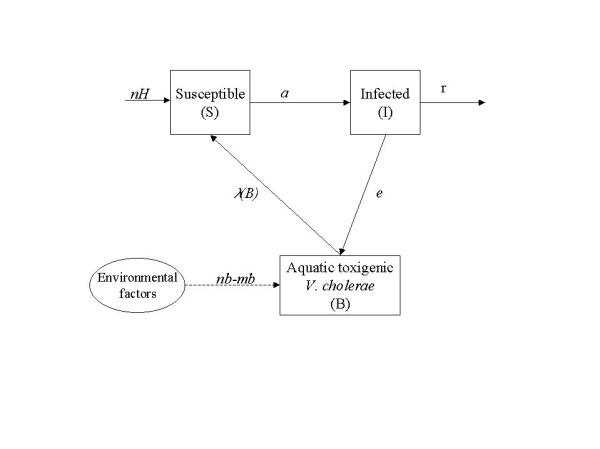
Figure 1.

Model diagram (symbols are listed in table 1). All individuals in population H are born susceptible. Susceptible people (S) become infected as they are exposed to contaminated water (i.e., to B). Infected people recover at a rate r. Recovered population is not explicitly included but its size can be estimated by H-I-S (since total population is constant). While infected, individuals contribute to the enhancement of bacterial population through excretion. Bacterial population in the aquatic reservoir (B) may also grow in the water at a rate determined by environmental factors (temperature, for example).
