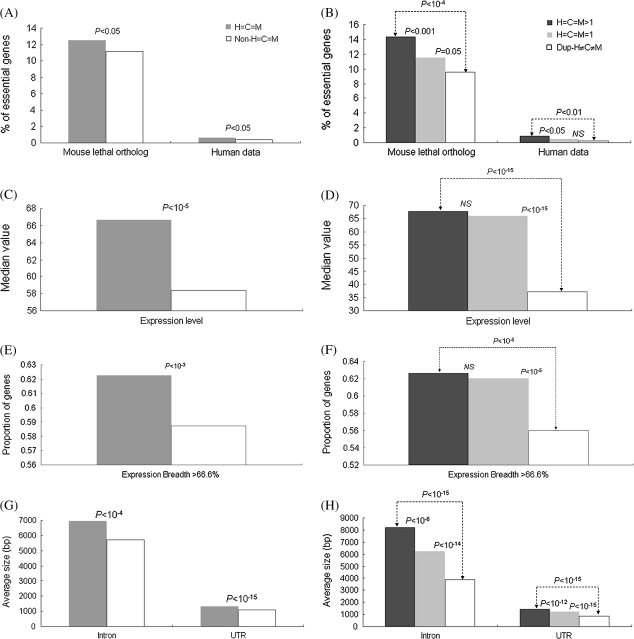
FIG. 3.
The left panel compares (A) the proportions of essential genes, (C) the expression levels, (E) the expression breadth, and (G) the gene compactness (average intron/UTR length) between gene families with and without size conservation (“H=C=M” and “non-H=C=M,” respectively). The right panel (B, D, F, and H) compares the four same features in the same order between singleton gene families with size conservation (“H=C=M=1”) and multigene families with or without size conservation (“H=C=M>1” and “dup-H≠C≠M,” respectively). The P values were estimated by using the two-tailed Fisher’s exact test (A, B, E, and F), the two-tailed Wilcoxon rank sum test (C and D), and the two-tailed t-test (G and H). NS, not significant.

