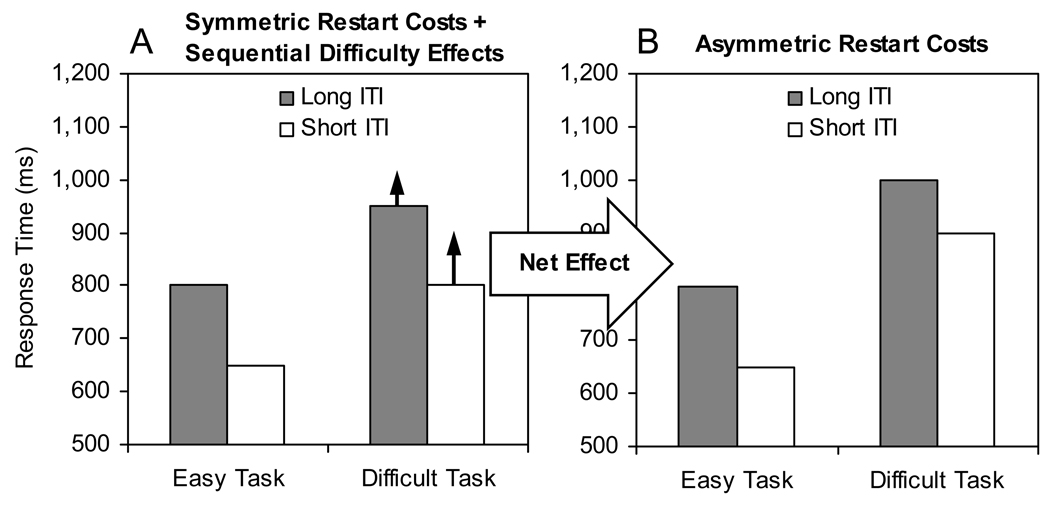
Figure 6.
Illustration of how sequential difficulty effects (i.e., slowing down after a difficult trial, as indicated by solid arrows) can combine with symmetric restart costs (panel A) to produce asymmetric restart costs (panel B), assuming that sequential difficulty effects are attenuated at longer intertrial intervals (ITIs).

