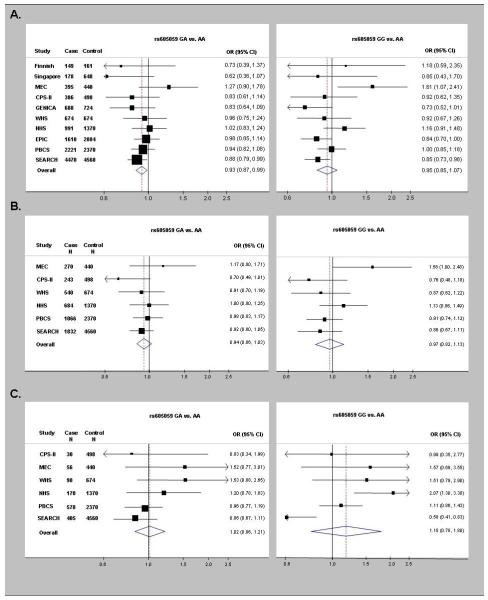
Figure 1.
Forest plots of study-specific odds ratios (OR) and 95% confidence intervals (CI) for the risk of breast cancer overall (A) and for risk of estrogen receptor (ER)-positive breast tumors (B) and risk of ER-negative breast tumors (C) associated with genotypes of rs605059. Studies are weighted and ranked according to the inverse of the variation of the log OR. The size of the boxes indicates the variance of the log OR. The solid line represents an OR of one and the dotted line represents the summary OR of all studies. The acronyms stand for the study names: CPS-II=American Cancer Society Cancer Prevention Study II, EPIC=European Prospective Investigation into Cancer and Nutrition cohort, GENICA=Gene Environment Interaction and Breast Cancer in Germany, NHS=Nurses’ Health Study, MEC=Hawaii-Los Angeles Multiethnic Cohort, Poland=Polish Breast Cancer Study, SEARCH=Studies of Epidemiology and Risk Factors in Cancer Heredity, and WHS=Women’s Health Study.

