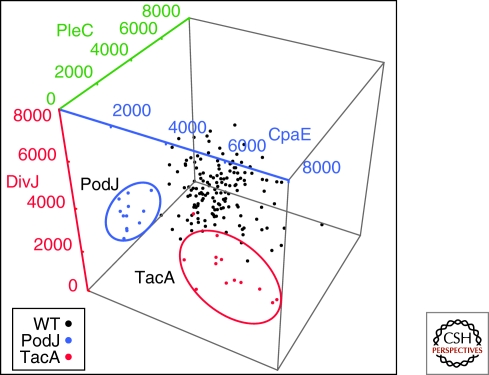
Figure 5.
Ensemble measurement of polar localized protein based on individual cell measurements. The polar fluorescence intensities of the CpaE-CFP, PleC-YFP, and DivJ-RFP reporter fusions are plotted for the nonmutagenized control strain (black) as well as gene disruptions in two separate open reading frames coding for the PodJ (blue) and TacA (red) proteins.

