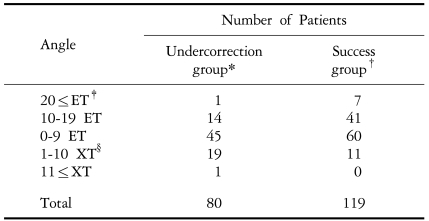
Table 3.
Distribution according to the near angle of deviation 1 day after surgery
P value=0.000, 2 sample t-test.
*: The group whose near and far angle of deviation 1 year after surgery was 9 or more. †: The group whose near and far angle of deviation was 8 or below or who had orthophoria. ‡: esodeviation, §: exodeviation.

