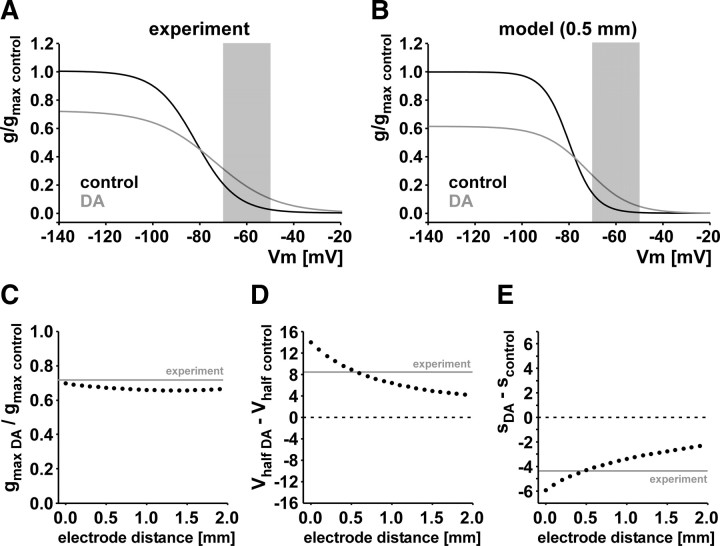
Figure 8.
The experimentally observed reduction of maximal conductance and increase of conductance at biologically relevant membrane potentials (shaded areas) are not qualitatively different when space-clamp errors are considered. A, Ih activation curves plotted as Boltzman equations from the experimentally obtained mean values shown in Figure 5 for control and DA, normalized to the maximal conductance in control. B, Reverse-engineered activation curves from a simulated two-electrode voltage-clamp experiment with an electrode distance of 0.5 mm. These activation properties gave rise to values very similar to the ones experimentally observed. C, Maximal conductance in DA as a fraction of the control value in axon models with different assumed electrode distances from 0 to 1.9 mm. All measurements showed reduced maximal conductances similar to the experimentally obtained value (gray line). D, The shift in the voltage of half-activation between control and DA, obtained from the same model measurements as in C. In all cases, the shift is in the depolarizing direction. E, The change in slope factor between control and DA as a function of electrode distance. In all cases, the slope factor changes becomes more negative, leading to shallower activation curves in DA and therefore to an increased range over which activation is voltage dependent.

