Figure 6.

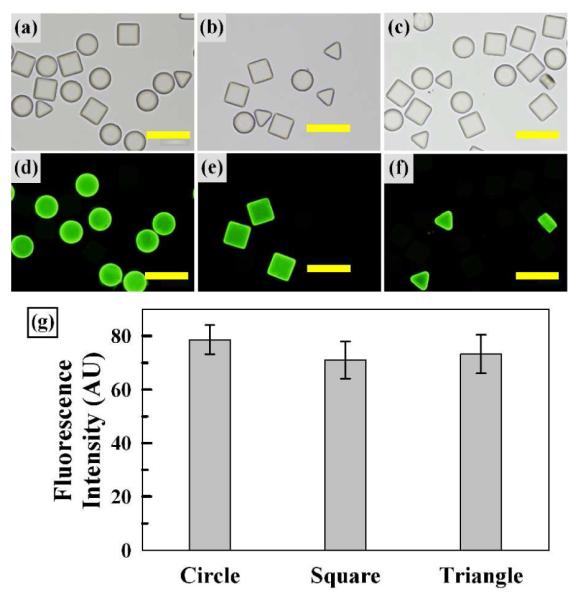
Sequence Specificity. Brightfield micrographs (a-c) of three microparticle types, all differing by the conjugated probe DNA sequence. Fluorescence micrographs (d-f) following hybridization with fluorescently labeled target DNA (200 nM) complementary to each particle type. Scale bars represent 200 μm. (g) Average fluorescence intensity graph for each particle shape. Error bars represent standard deviation from 3 particles.
