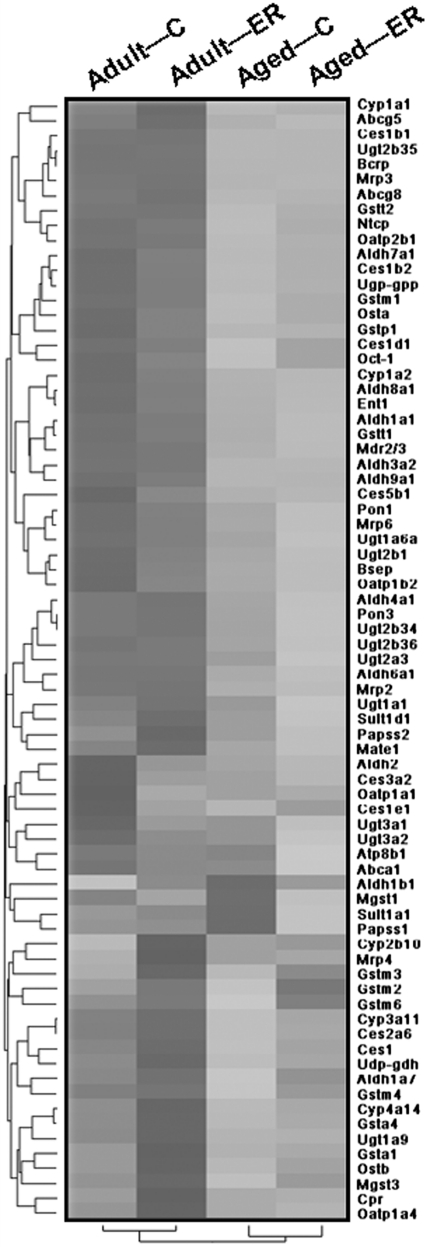
Fig. 10.
Hierarchical cluster analysis of effects of aging and ER on mRNA levels of DPGs in mouse livers. Each column represents an age-feeding group, and each row shows a particular gene with its name indicated on the right. The darkness of the region is positively correlated with the expression level. Each spectrum is specific to the scale of mRNA expression for each gene on an individual basis. Adult, 12 months old; aged, 24 months old; C, control. The same illustrations are also applicable to Fig. 11.

