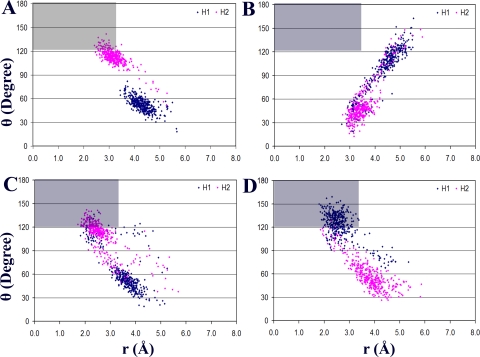
Fig. 2.
Ensembles of substrate orientations obtained from 100-ps MD simulations of phenacetin-enzyme complexes described by geometric parameters, distance r and angle θ. H1 in -OCH2- group of phenacetin is blue, and H2 is red. Gray regions, where the criterion (r ≤ 3.5 Å and θ ≥ 120°) is satisfied, represent productive binding orientations of phenacetin within the active site. CYP1A2 enzymes were WT (A), N312L mutant (B), L382V mutant (C), and L382V/T223N mutant (D).

