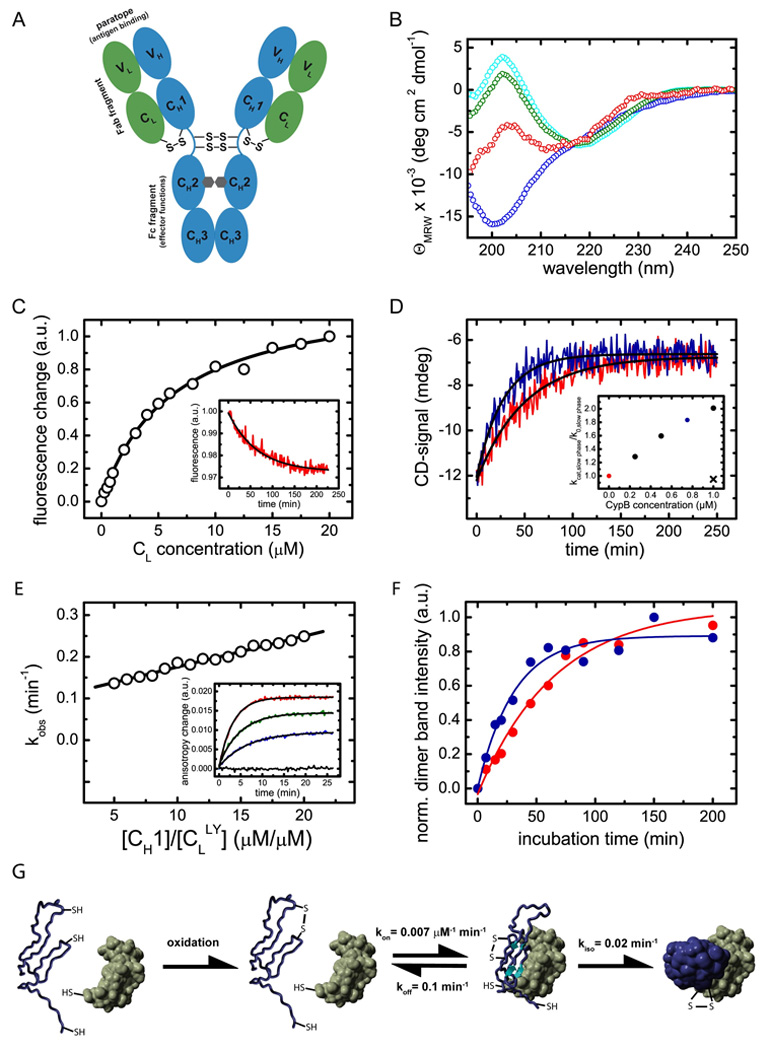
Figure 1. Structural characteristics of the CH1 domain and its assembly mechanism with the CL domain.

(A) shows a schematic representation of the IgG1 molecule. The IgG molecule is composed of two heavy chains (blue) and two light chains (green). The heavy chain consists of the VH, CH1, CH2 and CH3 domain and the light chain of the VL and the CL domain (listing from N- to C-terminus of each chain). The CH2 domains of the heavy chains are glycosylated with complex biantennary oligosaccharides (depicted in grey). Each domain possesses an internal disulfide bridge (omitted for clarity) and additional disulfide bonds link the two heavy chains in the flexible hinge region. A single disulfide bond covalently connects CH1 with the CL domain. The two identical antigen binding sites (paratopes) are made up by the two variable domains VH and VL. The overall IgG molecule can be divided into two Fab fragments (composed of VH, CH1, VL and CL) and one Fc fragment (composed of two CH2 and two CH3 domains). (B) The isolated CL domain (cyan) displays a typical all-β far-UV CD spectrum whereas the isolated CH1 domain (blue) shows a random coil spectrum. To assess if CL induces structural changes in CH1, the spectrum of co-incubated CL and CH1 was recorded (green). From this spectrum and the far-UV CD spectrum of the isolated CL domain, the spectrum of the CH1 domain in the presence of CL was calculated (red) which shows the characteristics of β-sheet secondary structure. (C) The affinity between CH1 and CL was determined by the change in the intrinsic fluorescence upon CL induced folding of the CH1 domain, recorded before and after a 4 h equilibration step. A one-site binding model was used to fit the data. The inset shows a representative single exponential trace observed after the addition of 1 µM CL to 2 µM CH1. A single exponential reaction with a very similar rate was observed by far-UV CD spectroscopy (D, red trace). The folding reaction could be accelerated by the PPIase CypB (red trace: 10 µM CL and 10 µM CH1 alone, blue trace: in the presence of 0.75 µM CypB). The inset shows the dependence of the slow reaction on CypB concentration. The observed rate in the absence of CypB is denoted as k0, in the presence of CypB as kcat. If 1µM CypB was inhibited by 2 µM cyclosporine A, no acceleration was observed (black cross). (E) Association of the CH1 domain with a lucifer yellow labeled CL domain was followed by the change in the lucifer yellow anisotropy signal. The observed rate constants were fitted with a linear function to yield the kon value and the koff value of 0.007 ±0.0002 µM−1 min−1 respectively 0.1 ±0.01 min−1. The inset shows individual single exponential traces after the addition of 0 µM (black), 5 µM (blue), 10 µM (green) and 20 µM (red) CH1 to 1 µM labeled CL. (F) To assess the formation of the CL/CH1 interchain disulfide bridge, non-reducing SDS-PAGE experiments were carried out and the dimer band intensity was quantified. 25 µM of each domain were used. In the absence of CypB (red), a time constant of τ = 63 ±7 min was observed for the formation of covalent CL/CH1 dimers. In the presence of 5 µM CypB, a time constant of τ = 31 ±5 min was obtained. In (G), the overall CH1/CL assembly mechanism is shown. Only after formation of the internal disulfide bridge in the CH1 domain (blue), the fast formation of a dimeric intermediate with the CL domain (green) is observed. Subsequently, prolyl isomerization limits complete folding and formation of the interchain disulfide bridge. All measurements were carried out at 25°C in PBS.
