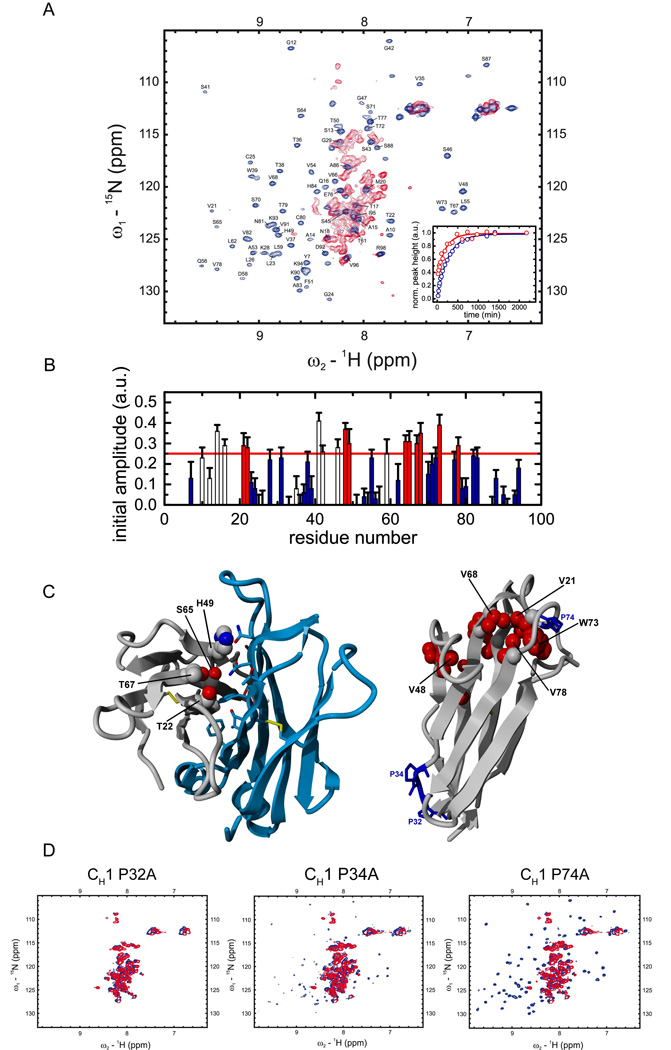
Figure 2. NMR spectroscopic characterization of CL induced CH1 folding.

(A) 15N-1H HSQC spectra of the isolated CH1 domain (red) and the assigned CH1 domain in complex with the CL domain (blue) are shown. In order to characterize the folding pathway of the intrinsically disordered CH1 domain, time dependent HSQC intensities upon addition of unlabeled CL to 15N labeled CH1 were measured for each assigned residue at the native chemical shift position and fitted by a single exponential function. Two representative traces for Val68 (red) and Lys90 (blue) are shown in the inset. (B) Initial amplitudes for each assigned CH1 residue were derived from the fitted exponential functions. Residues with an initial HSQC amplitude below a threshold of 25% native intensity are colored in blue and residues above the threshold in red (open bars: residues in loop regions / filled bars: residues in structured regions). Errors indicate standard deviations from single exponential fits. In (C) CH1 residues with intensities above the threshold in the intermediate are mapped on the crystal structure of the CH1/CL dimer (pdb code 1Q9K). The dimerization interface between CH1 (grey) and CL (blue) is shown on the left with only residues of CH1 indicated that are involved in this interaction and above the HSQC amplitude threshold. On the right, internal CH1 residues above the 25% threshold are shown in red, the three cis proline residues in CH1 are depicted and labeled in blue. (D) The HSQC spectra of the CH1 Pro32Ala, Pro34Ala and Pro74Ala mutants show, that only the Pro32Ala mutant is not able to fold in the presence of CL anymore (blue spectrum). For the other two mutants, Pro34Ala and Pro74Ala, well dispersed spectra and hence folding are observed in the presence of CL (blue spectra). In the absence of CL (red spectra), all three mutants show typical HSQC spectra of unfolded proteins. All measurements were carried out in PBS at 25°C except for the folding kinetics which where recorded at 12.5°C.
