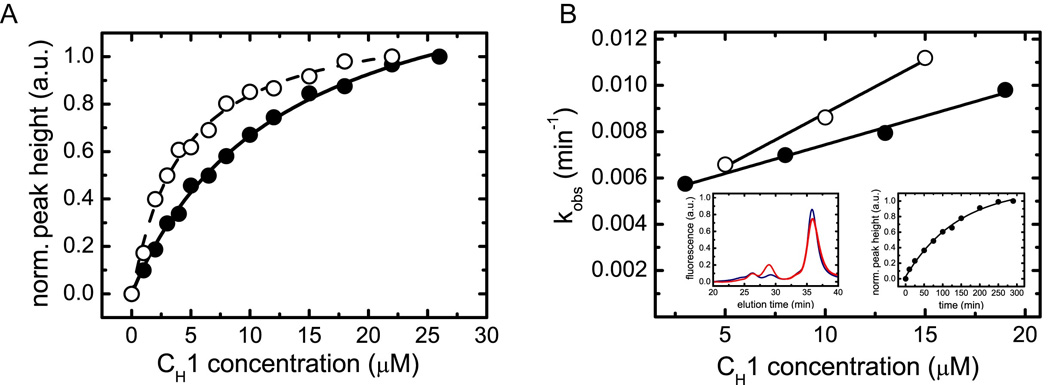
Figure 3. Characterization of the interaction between BiP and CH1 in vitro.

(A) The affinity between BiP and oxidized CH1 (filled circles, straight line) as well as reduced CH1 (open circles, dashed line) was determined by analytical HPLC experiments. The data were fitted to a one-site binding model to determine the Kd. (B) The association kinetics between 1 µM BiP and varying concentrations of oxidized CH1 (filled circles) and reduced CH1 (open circles) were measured to determine the rate constants of the reaction. For oxidized CH1, kon = 0.00026 ±0.00002 µM−1 min−1 and koff = 0.0050 ±0.0002 min−1 were obtained. For the reduced CH1 domain, the corresponding values were kon = 0.00041 ±0.00003 µM−1 min−1 and koff = 0.0047 ±0.0003 min−1. The left inset shows single HPLC runs of 8 µM oxidized CH1 and 1 µM BiP after 10 min (blue) and 200 min (red) co-incubation. The right inset shows the overall observed single exponential association kinetics between 1 µM BiP and 8 µM oxidized CH1.
