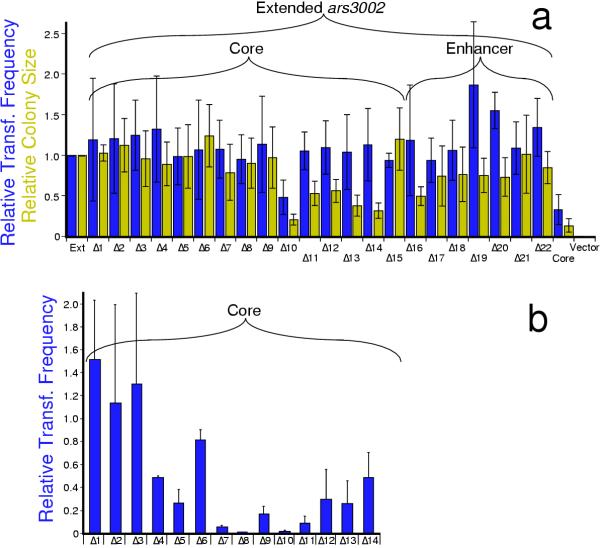
Figure 3.
Effects of deleting stretches of ~50-bp from (a) extended ars3002 or (b) core ars3002. In (a), transformation frequencies (blue bars) and mean colony sizes (gold bars) are shown relative to those of modified extended ars3002 (sequence in Fig. 2). Each bar represents the mean of four independent experiments, and the error bars show standard deviations. Controls include intact, extended ars3002 (Ext), intact core ars3002 (Core), and vector alone (Vector; pUra4script [10]). Panel (b) shows our previously published [10] transformation frequency results for deletions Δ1-Δ14 in core ars3002, in the absence of the enhancer. Here the values are relative to intact core ars3002, which is a much less efficient origin than extended ars3002 (see panel (a)). In panel (b), the results are the averages of two experiments, and the error bars show the data range.

