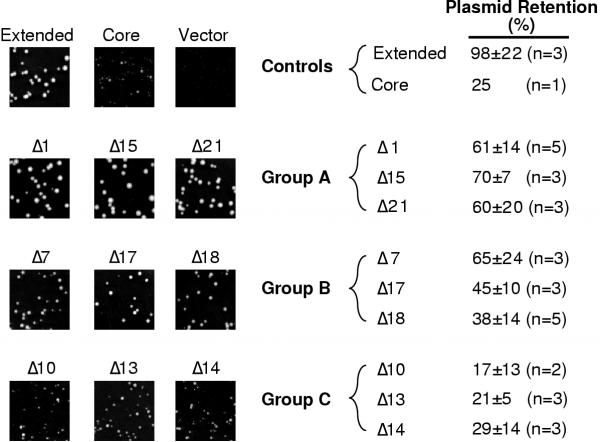
Figure 4.
Correlation between plasmid retention rate and colony size. Groups A, B and C consist of deletion mutants producing large, medium and small colonies, respectively. See the text for details. Images of colonies on Petri plates were photographed at the same magnification 5 days after transformation. Plasmid retention rates are shown with standard deviations and number of transformants tested (in parentheses).

