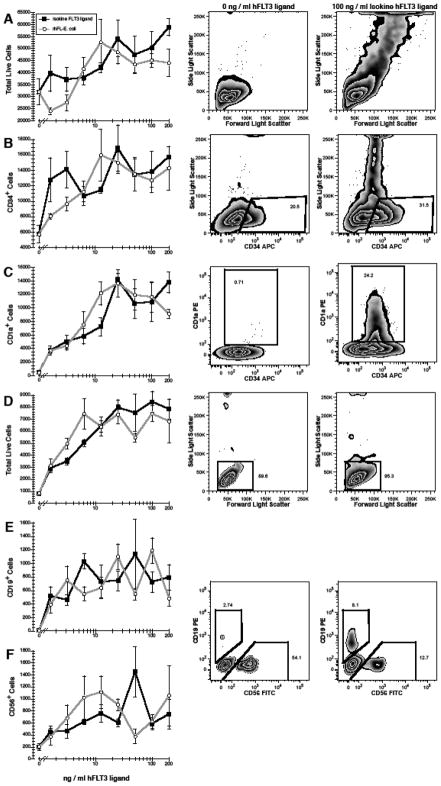
Figure 3.
Effects of ISOkine Flt3 ligand on the growth and differentiation of hematopoietic stem cells and progenitors. 3 × 10² purified CD38−CD34++ (A–C) and 2 × 10³ CD38+CD34++ (D–F) cells were cultured with ≤200 ng/ml Flt3 ligand from barley or bacterial source. In addition, all CD38−CD34++ cultures contained GM-CSF+IL-15 and lymphopoiesis was supported in all CD38+CD34++ cultures by IL-7+IL-15. Data in the line plots represent the mean±standard error. Representative flow cytometric plots are shown for cultures without Flt3 ligand (center column) and with 100 ng/ml ISOkine Flt3 ligand (right column). All flow cytometric plots are gated to show only live (PI−) cells (not shown). Note the presence of high side-light scatter cells in cultures with ISOkine Flt3 ligand in row A. Polygons in rows B and C represent the electronic gates used to define the cell populations shown in the corresponding line plots. B- and NK-cells were defined by a low side-light scatter as shown indicated by the rectangular gat in row D and by polygonal gates used to define CD19+ and CD56+ cells as indicated in rows E–F. Numbers indicate the percentage of events that fall within the corresponding gate.

