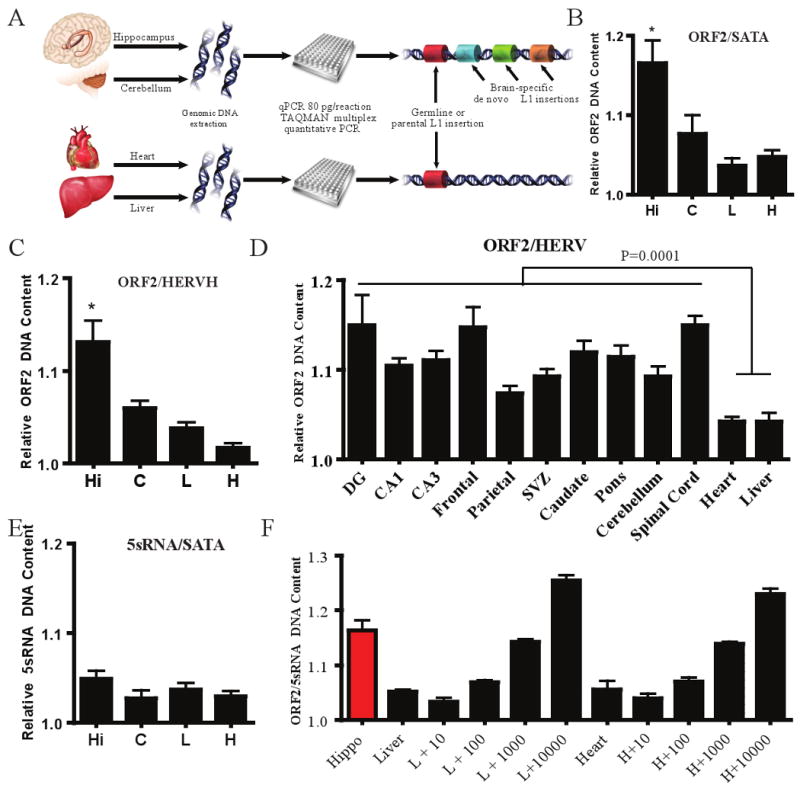
Figure 4. Multiplex quantitative PCR analyses of L1 copy number in human tissues.

a, Experimental schematic. b-c, Relative quantity of L1, standardized such that the lowest liver value was normalized to 1.0. Hi = hippocampus, C = cerebellum, H = heart, and L = liver. Additional L1 ORF2 assays with other internals controls, Fig. S9-10. Error bars all s.e.m. *, p<0.05 (repeated measures one-way ANOVA with Bonferroni correction, n=3 individuals, with 3 repeat samples from each tissue). d, Ten samples from various brain regions (n=3 individuals) compared to somatic liver and heart. One-way t-test, p ≤ 0.0001 with 34 degrees of freedom. e, Multiplexing of 5S rDNA with α -satellite indicated no significant change, p≤0.5054. f, Hippocampal tissue compared to liver and heart spiked with estimated plasmid copy numbers of L1 (10, 100, 1,000, and 10,000 copies).
