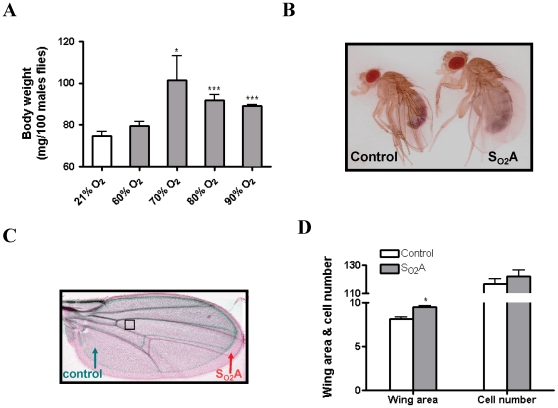
Figure 1. Phenotypic changes following long-term hyperoxia selection.
A) Three sets of 100 hyperoxia–selected (SO2A) male flies, which were perpetually living in 90% O2, were collected from each chamber and weight was averaged. SO2A flies (grey bar) have an increased body weight as compared to control flies (white bar) when O2 concentration was 70% (p<0.05) or above (p<0.001). B) A representative image from control flies and SO2A flies is shown in Fig. 1B. C & D) Wings from 12 male flies in each group were collected and imaged by an Axiovert 200 M microscope. Wing area and cell number were determined using Image J. A representative picture of wings from a control (green) and a SO2A (red) fly was shown in Fig. 1C, cell number was measured in the area of wings shown in square. SO2A flies had a larger wing area than control flies (p<0.05) and the cell number per area was not different between two groups. * indicates p<0.05; ** indicates p<0.01; *** indicates p<0.001.

