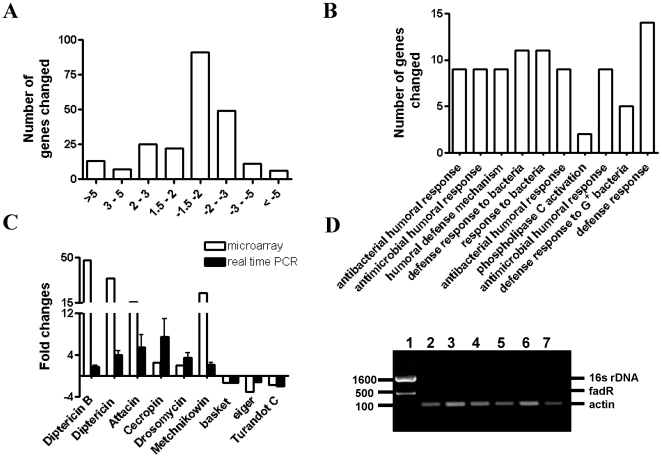
Figure 3. Gene expression profile changes following long-term hyperoxia selection.
A) Number of genes that were significantly altered in the microarrays was summarized based on their fold changes. B) Significantly altered biological processes in the microarrays were determined by MAPPFinder and GenMAPP 2. The top 10 biological processes with the lowest p value were shown in Fig. 3B. C) Microarray data were validated by real time RT-PCR and each bar represents the average of at least three samples for each gene. D) 16s rDNA PCR products were examined in control flies and SO2A flies that were cultured in the standard cornmeal agar medium. E.coli DNA was used as positive control; fadR and actin were used as loading control for E. coli and fly samples respectively. Lane 1: E. coli DNA; Lane 2–4: control flies; Lane 4–7: SO2A flies.

