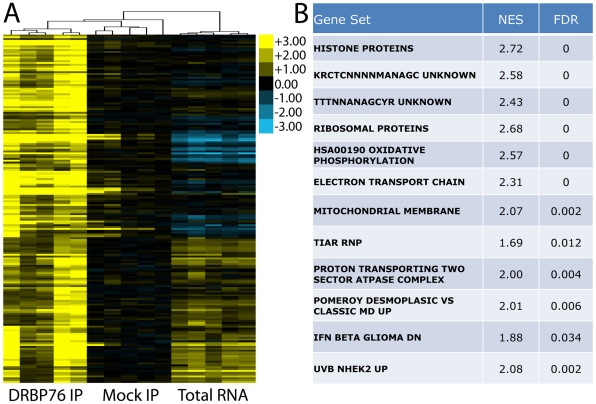
Figure 5. Enrichment of DRBP76-associated mRNAs and their common functional grouping.
A. Heatmap displaying results of clustering DRBP76 IP, mock IP and total mRNA levels for all DRBP76 targets (n = 189). B. Gene sets significantly enriched in the DRBP76 IP vs. mock IP as determined by GSEA. NES = normalized enrichment score, FDR = false discovery rate.

