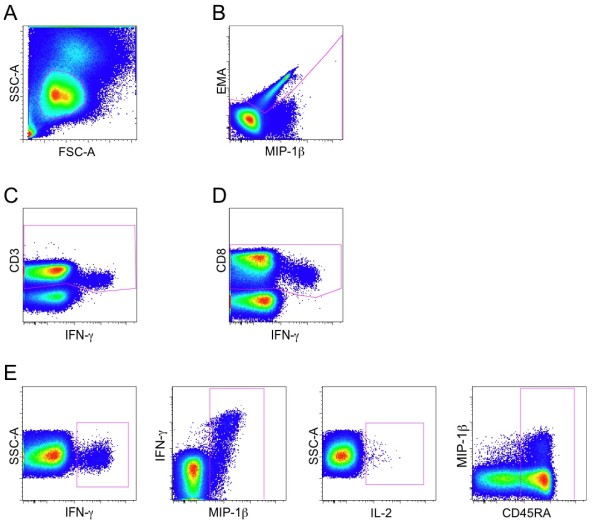
Figure 1.

Gating strategy for the definition of responding and CD45RA+ CD8+ T cells. First, lymphocytes were gated based on FSC versus SSC plot (A), followed by exclusion of dead cells by EMA staining (B). As representatively shown, we gated for CD3+ cells on all functional markers to account for CD3 downregulation in antigen specific responding T-cells and combined these gates with the Boolean operator "OR" to obtain the CD3+ cell population (C). As representatively shown, we gated for CD8+ cells on all functional markers to account for CD8 downregulation in antigen specific responding T-cells and combined these gates with the Boolean operator "OR" to obtain the CD8+ cell population (D). CD4+ T cells were excluded from the CD8+ T-cell population. Once the CD8+ T-cell population was defined, cells positive for IFN-γ, MIP-1β, IL-2 and CD45RA were separately identified by using 4 different plots in which the axis were chosen to provide the best discrimination between positive and negative events (E). The complete gating strategy is shown for patient NP13. Selection of positive cells for the functional markers was done by comparison with a mock-stimulated sample.
