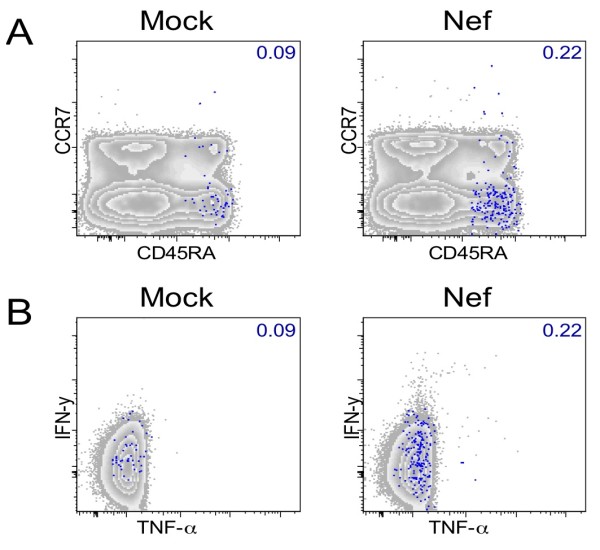
Figure 5.

Characterization of Nef-specific CD45RA+ IFN-γneg MIP-1β+ CD8+ T cells. Total CD8+ T cells of patient V4 are shown according to CD45RA/CCR7 (A) and TNF-α/IFN-γ (B) expression. Grey zebra plots show total CD8+ T cells. Percentages of CD45RA+ IFN-γneg MIP-1β+ CD8+ T cells, shown as blue dots are indicated in each graph. Mock-stimulated control samples are shown in the left and Nef-stimulated samples in the right panels.
