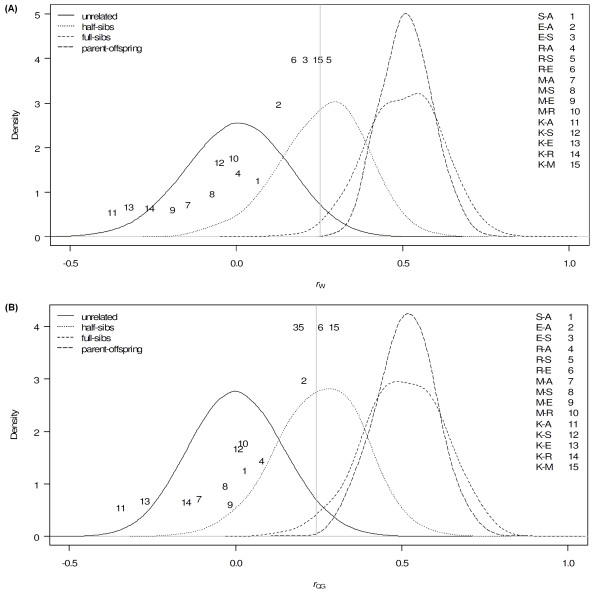
Figure 1.
Pairwise relatedness of Yakutian cryo-bank bulls. Values are calculated using (A) rW and (B) rQG relatedness estimators plotted on a distribution of four simulated relationship categories: unrelated, half-sibs, full-sibs and parent-offspring; the vertical line represents the 95th percentile for simulated unrelated individuals; the position of pairwise values in regards to the Y-axis was designed based on the estimates from the rK relatedness estimator and was calculated as 3 divided by the cases when the log likelihood of R for the second closest relationship is smaller than the most likely relationship; abbreviations for Yakutian cryo-bank bulls are: K-Keskil, M-Moxsogol, R-Radzu, E-Erel, S-Sarial, A-Alii. Y-axis denotes the distribution of posterior probability density based on the simulations of the four relationship categories using the two relatedness estimators rW and rQG, respectively.

