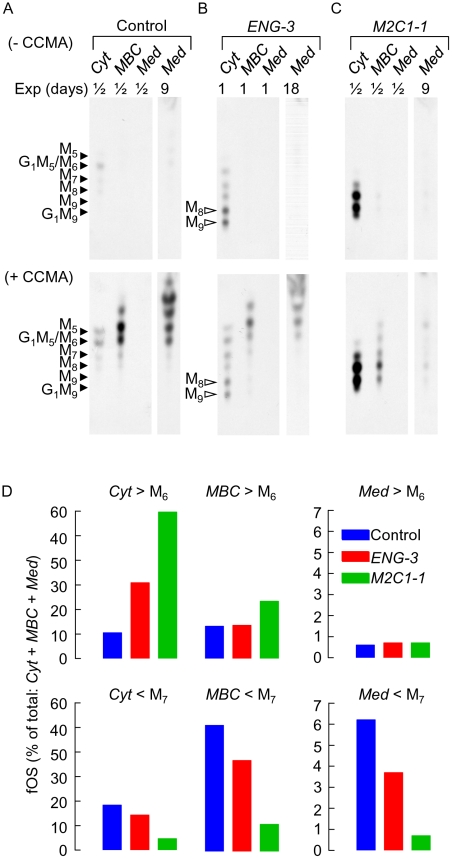
Figure 2. Subcellular distribution of fOS in control and CCMA-treated cells after down regulation of Engase1p and Man2c1p.
Three days after cells were transiently transfected with either (A) control RNAi duplexes (Control) or (B) RNAi duplexes targeting ENGASE (ENG-3) or (C) MAN2C1 (M2C1-1), cells were pulse-radiolabeled with [2-3H]mannose, and submitted to 6 h chase incubations in the absence (A, B and C, upper panels) or the presence of 10 nM CCMA (A, B and C, lower panels). Cells were then permeabilized with SLO as described in Material and Methods. fOS purified from the cytosolic fraction (Cyt) and the membrane bound compartments (MBC) and from the chase media (Med) were resolved by TLC. TLC plates were exposed to film for different numbers of days (Exp) in order to better visualise components whose abundances differ greatly between conditions. The migration positions of standard oligosaccharides are shown to the left of the chromatographs and the abbreviations associated with the open arrowheads are: M9, Man9GlcNAc2; M8, Man8GlcNAc2; the abbreviations associated with the closed arrowheads are: G1M9, GlcMan9GlcNAc; M9, Man9GlcNAc; M8, Man8GlcNAc; M7, Man7GlcNAc; M6, Man6GlcNAc; G1M5, GlcMan5GlcNAc; and M5, Man5GlcNAc. D. Oligosaccharides were eluted from the chromatograms corresponding to the fluorograms shown in the lower panels of A, B and C (+ CCMA) and quantitated by scintillation counting. To simplify interpretation of results, radioactivity associated with oligosaccharides greater in size than Man6GlcNAc (> M6) was summed as was that obtained for oligosaccharides smaller than Man7GlcNAc (< M7). The bars indicate the percentage of total fOS recovered from each incubation. This experiment was performed once.

