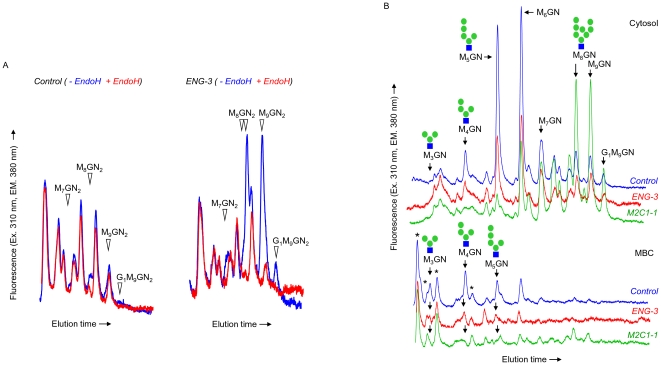
Figure 3. Effects of Engase1p and Man2c1p down regulation on steady-state levels of cytosolic and MBC fOS in HepG2 cells.
fOS recovered from both the cytosol and the MBC fractions of SLO-permeabilized, control siRNA (Control), ENG-3 or M2C1-1 -transfected cells, were derivatized with 2-AP, and analyzed by HPLC before (− EndoH) and after digestion with EndoH from S. plicatus (+ EndoH). A. HPLC profiles of the cytosolic PA-derivatized fOS obtained before (Blue traces) and after EndoH (Red traces) digestion from control siRNA (Left panel) or ENG-3 (Right panel) transfected HepG2 cells. The open arrowheads indicate the migration positions of fOSGN2-AP derivatives whose appearance is abrogated after EndoH digestion. Only the region of the chromatograms that display significant differences before and after EndoH digestion is shown. B. The EndoH treated fOS from the cytosol (Upper panel) and membrane bound compartments MBC (Lower panel) were resolved by HPLC and the migration positions of standard radioactive oligosaccharide 2-AP derivatives are indicated, and where known, the isomeric configuration of the standard structures are indicated (Green circles; mannose, blue squares; N-acetylglucosamine). The asteriks indicate peaks corresponding to oligosaccharides whose abundance does not change under the different conditions. In both A and B the background noise associated with the ENG-3 profiles is higher than in either the control or M2C1-3 traces because the fluorescence scale was amplified to take into account the smaller amount of cells recovered from ENG-3 transfected cultures. This experiment was performed once, but a preliminary experiment, in which cells were not permeabilised with SLO, was performed and found to give qualitatively similar results.

