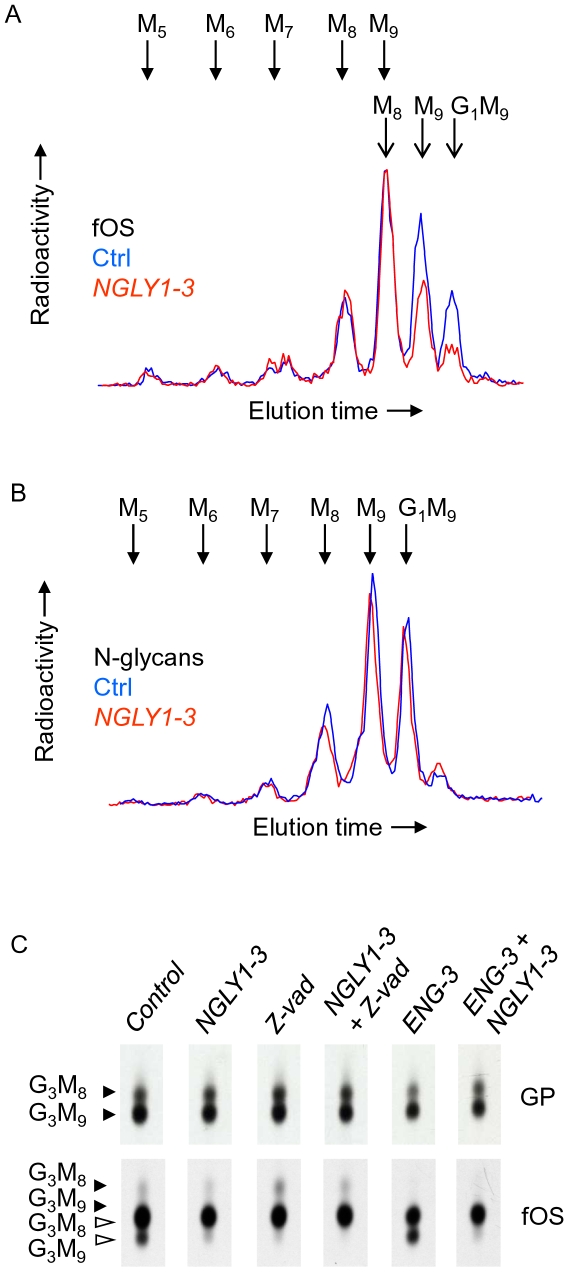
Figure 5. Examination of fOS, and N-glycans after NGLY1-3 or Z-vad mediated reduction of Ngly1p activity in control and castanospermine-treated cells.
A. HepG2 cells were transfected with 25 pmoles of control siRNA (Ctrl), or 25 pmoles of NGLY1-3. Three days after transfection, cells were pulse-radiolabeled with [2-3H]mannose for 30 min and cellular EndoH-released [2-3H]N-glycans (N-glycans) and [2-3H]fOS (fOS) were prepared and analysed by HPLC. Whereas the whole fOS fractions were analysed, only 25% of the N-glycan fractions were examined by HPLC. The elution positions of standard oligosaccharides are indicated above the HPLC profiles and the abbreviations used are defined in the legend for Fig 2. B. HepG2 cells were transfected with 50 pmoles of control siRNA (Ctrl), or 25 pmoles each of NGLY1-3 and 25 pmoles of control siRNA (NGLY), or 25 pmoles each of ENG-3 and 25 pmoles of control siRNA (ENG), or 25 pmoles each of NGLY1-3 and ENG-3 (ENG + NGLY). Three days after transfection, cells were preincubated for 30 min with 2 mM castanospermine (CST), and where indicated, with 40 µM Z-vad-fmk (Z-vad). Cells were then pulse-radiolabeled with [2-3H]mannose for 30 min and cellular EndoH-released [2-3H]N-glycans (GP) and [2-3H]fOS (fOS) were prepared and examined by TLC. The scanned TLC lanes are from the same fluorograph, but due to uneven migration, the scans were aligned manually to facilitate interpretation of data. Closed and open arrowheads indicate the migration positions of components bearing one or two residues, respectively, of GlcNAc at their reducing end. The abbreviations are: G3M9; Glc3Man9GlcNAc1-2, G3M8; Glc3Man8GlcNAc1-2. C. These experiments were performed once.

