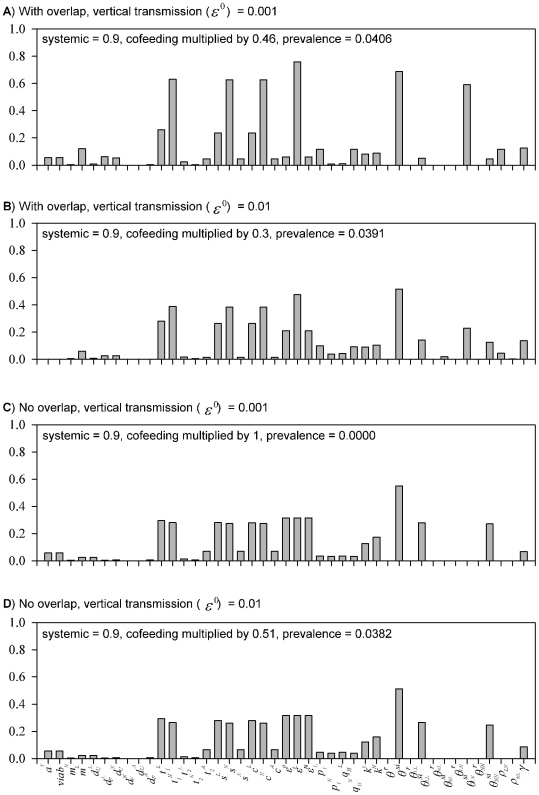
Figure 4. Relative importance of the input parameters.
Elasticity values of the input parameters with inter-cohort overlap (A, B) and without overlap (C, D). Case 1 – lower vertical and higher cofeeding transmission – the parameters related to nymphs have much higher elasticities, indicating that nymphs play the critical role in determining R0. The cofeeing transmission parameter ( ) has high elasticity, and it is dominated by the pathway from nymphs to larvae (
 ). Case 2 – higher vertical and lower cofeeding transmission – the parameters for larvae increase elasticities.

