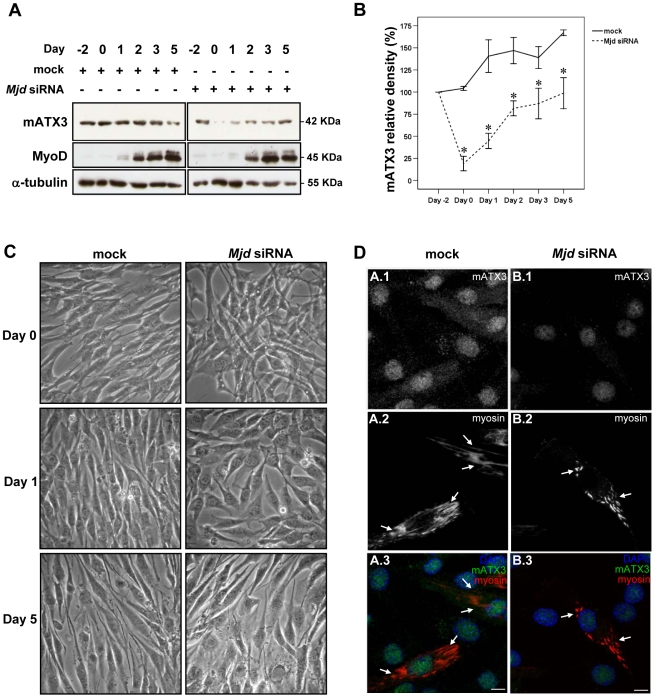
Figure 2. Expression profile of mATX3 during C2C12 differentiation and phenotype of mATX3-depleted cells by Mjd siRNA transfection.
Cells were transfected at Day -2 and maintained in growth medium (GM) for 48 hrs (Day 0), then the medium was replaced by differentiation medium (DM) and changed every day until Day 5. (A) Whole cell extracts of undifferentiated (Day -2 and Day 0) and differentiated cells (Day 1 to Day 5) were analyzed for mATX3, MyoD and α-tubulin in mock and Mjd siRNA transfected cells. The amounts of ataxin-3 and MyoD were determined by immunoblotting. The myogenic factor MyoD is not a target of mATX3. Both mock and Mjd siRNA-transfected cells show that this MRF is upregulated upon differentiation. (B) Relative band density of mATX3 in each day (comparing with Day -2) shows that the Mjd siRNA has maximum efficiency two days after transfection (Day 0). The results were normalized for α-tubulin and correspond to the average of three independent transfections ± SEM (error bars). * statistical significance p<0.05 using Student t-test. (C) Phenotype of the Mjd siRNA C2C12 cells during differentiation. At Day 0 and Day 1, when mATX3 depletion is higher, the Mjd siRNA cells show extensive cell-cell misalignment, and rounder shape compared to mock-transfected cells. Although the mATX3 levels were partially restored at Day 5, the knocked-down cells still present some misalignment. (D) The maximum projection of confocal optical z-series images of mATX3 and myosin double-stained cells at differentiation Day 5. In contrast to mock control cells that show a well organized myosin cytoskeleton (arrows), mATX3-depleted cells show an abnormally fragmented myosin staining with a very short filament pattern. (1) mATX3 staining, (2) myosin (MHC) labeling, (3) triple overlay of mATX3, myogenic marker, and DAPI (DNA marker). Scale bars represent 10 µm.

