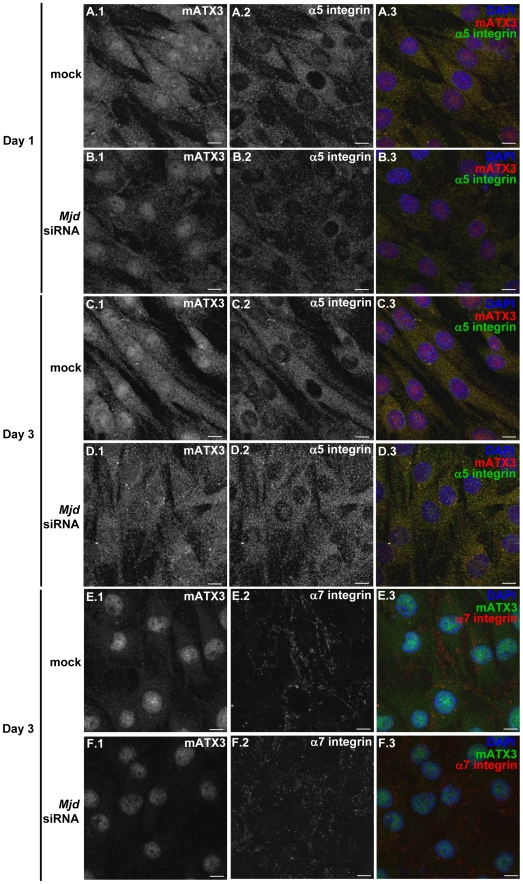
Figure 4. α5 and α7 integrin subunits are down-regulated in mATX3-depleted cells.
Maximum projection of confocal z-series images of double immuno-stained cells for mATX3 (1) and α5 or α7 integrin subunit (2). (A–D) C2C12 differentiated cells labeled with mATX3 (red) and α5 integrin subunit (green): at Day 1, mATX3-depleted cells are misaligned and exhibit reduced levels of mATX3 and α5 integrin subunit (B), compared to controls (A); and at Day 3, the Mjd siRNA transfected cells still present lower amounts of mATX3 and α5 integrin subunit and considerable misalignment (D) in comparison to controls (C). Note that the stronger reactivity for mATX3 in Mjd siRNA cells at Day 3 (D.1 vs B.1) is accompanied by a similar increase in α5 integrin subunit reactivity (D.2 vs B.2,). (E–F) mATX3-depleted and differentiated cells at Day 3 labeled with mATX3 (green) and α7 integrin subunit (red) show reduced levels of mATX3 and α7 integrin subunit (F) compared to controls (E). DNA was stained with DAPI (blue) as shown in the overlay (3). Scale bars represent 10 µm.

